Data visualisation or datafication of a visual ?
Humans are visual creatures and graphs are beautiful to behold, like fireworks displays or flocks of birds. Yet, one often fails to see the forest for the trees. Human domain experts tend to be bewildered and daunted when tasked to read information from graph diagrams.
Instead, we are used to working with diagrams that schematically represent information. Domain experts, architects, machine builders, managers, organisation experts, etc. are trained to read schematic drawings that follow well defined conventions.
This begs the question whether it's possible to bridge the gap between schematic diagrams and linked data.
This story shows how Visio, which in fact is powerful 2D CAD software, can indeed produce Linked Data from railway signalling diagrams.
Signalling schemes are diagrams that are subject to strict design rules. The shapes in such drawings are templated and carry properties well understood by signalling experts. Typically, designers avail of stencils with master shapes, e.g. representing signals, tracks, railway crossings, train detection kit, etc. The designer drops these master shapes on the drawing sheet, close to a linear shape representing a track. The track is sectioned by shapes representing rail joints. Level crossings are drawn where the tracks are crossed. Text annotations reveal to the domain expert which interlocking equipment controls which trackside kit.
The attentive reader will note that shapes on technical drawings are representations of linked data - for expert eyes only. Master shapes in a stencil are types, shapes in the drawing are instances thereof. Crudely speaking, the position of a signal with respect to the track is a link between objects of type signal and track. This is the kind of information that is visible in drawings and that can be expressed as Linked Data.
The rail- and data-graph are isomorph
The phrase "a signal is located at a spot to the left of a track at a given distance-along" can be deconstructed in a few statements. Similarly, one can state that "the signal works in direction "up" and is controlled from a given interlocking".
Describing what one sees in a diagram is like painting-by-statements. Also, this suggests that the linked data reflect the topology of the railway network. This is completely different from the classic asset-centric approach where one would have tables of tracks, signals, cables, and so forth. Answering a seemingly simple question like "what kit will a train encounter when travelling from A to B" is hard because one first needs to collate the data from the various sources.
Retaining in data the network topology, i.e. isomorphism, makes answering such questions a breeze.
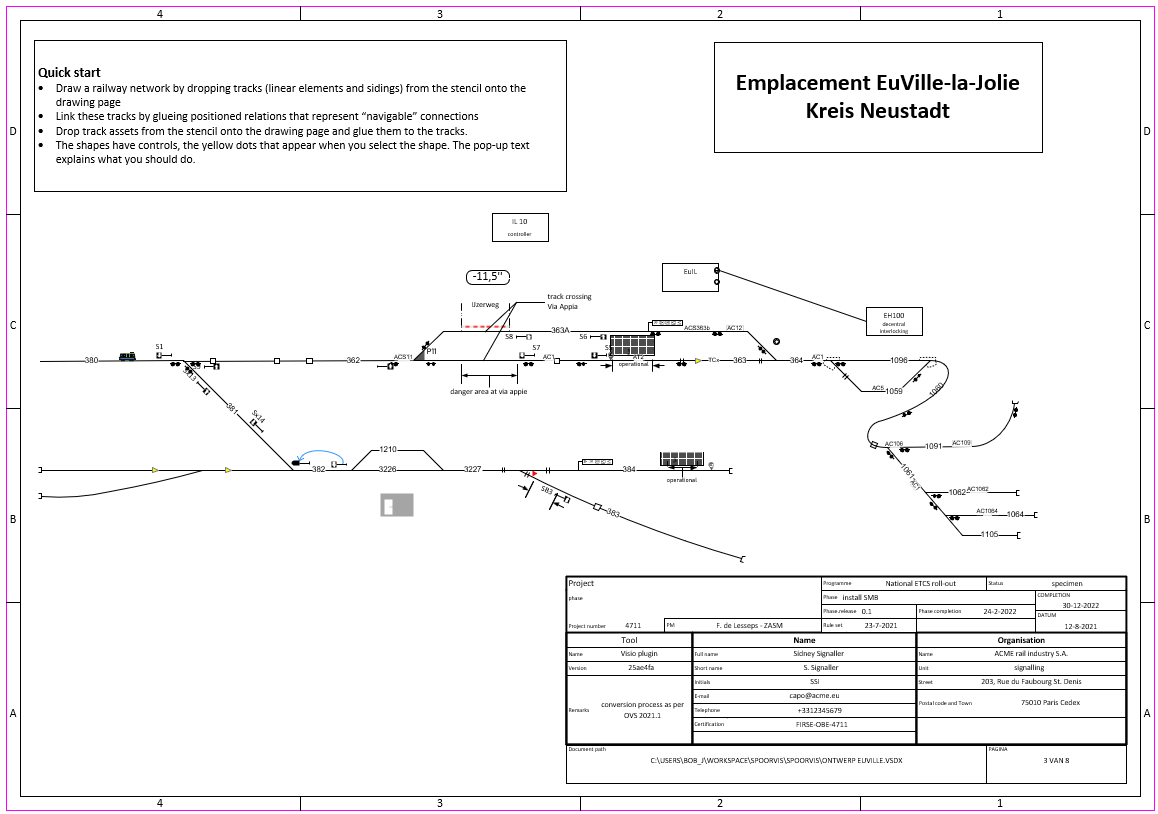 This is a schematic representation of a railway yard drawn in Visio. The shapes represent trackside objects that are linked to the tracks.
Because a railway is a network it makes perfect sense that trackside equipment and information about kit are linked. Below graph demonstrates the link between signals and positions on track. This indicates that one can navigate from a signal object to any relevant piece of information.
A query like "what is the distance along track of two signals" is solved by a few lines of code involving graph traversal.
Subgraph of the nodes in the dataset, filtered to nodes between, and including positions and signals. The essence of Linked Data.
From structured data to Linked Data
Check out Drawing Data for details on how one can coax Microsoft Visio into producing structured data. XML In a nutshell, Visio knows how to map shapes on display to objects that are stored in a tree in memory. This object tree is serialised into a document, ready for distribution.
The next step is to turn structured data, into Linked Data.
We use the following facts about our document structure
- backed by a schema that reveals the semantics and hierarchic relations of elements.
- every underlying element can be reached by "walking the tree", departing from the root
- elements have an identity that other elements can cross-reference
- each element in the document resides in a namespace
- elements in the document are subject to a taxonomy
This lifts the veil from the approach towards turning data organised as a structured document into Linked Data:
- starting from the root, walk down the element tree.
- for each element, establish an IRI by concatenating the namespace URL with the element name, e.g.
<http://ProRail.nl/EulynxData/Signals/S12> a <http://dataprep.eulynx.eu/schema/ProRail/Signal> - a parent element is composed of it's child elements. The composition has a name that acts as a predicate. So the s-p-o triplet becomes
parent - owns - child - likewise, a cross-reference turns into an association where the triplet is
element - refersTo - element. - subclassing relations are given when an element derives from a type
Where are my signals
Below table follows the links from signal to position on track. Network engineers tend to distinguish geographical position from position in the network. The location of kit on the surface of the earth is less of interest than where it's positioned in the network. The ability of querying linked information answers frequently asked questions such as
- what kit does a train encounter when travelling from A to B
- at what distance beyond signal x is the balise y
- what is the distance along a path between two objects
- what is the number of signals, points, axle counters in my network ?
Such questions are raised by users from different domains, e.g. surveyors, signalling engineers, maintenance engineers, buyers, etc. It's a boon to have a unique set of linked data instead of siloed data that may not match or that are hard to understand and process.
Signals are located with respect to the track, the distance along is the distance travelled along the track from the start of the track. The unit may differ and can be e.g. mile, mm, etc.
How much track have we got ?
Below query is simple. It selects the tracks, navigates to their lengths and sums them up. But beware, lengths can be given in units other than metre, so, we check them just to make sure there are no odd units such as imperial miles or cape feet.